Next: Band dispersion Up: User's manual of OpenMX Previous: Converting the file format: Contents Index
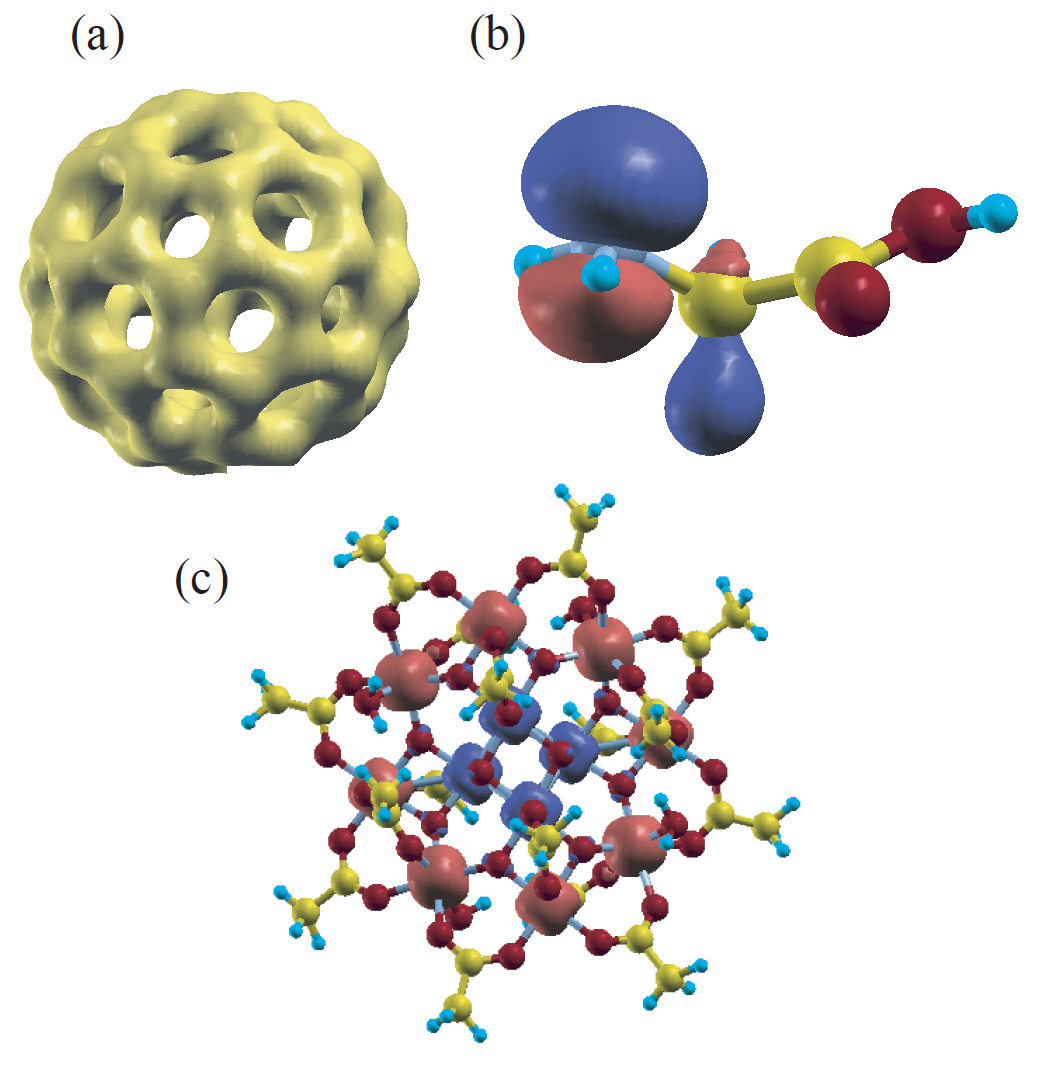
The electron densities, molecular orbitals, and potentials are output to files in a Gaussian cube format. Figure 13 shows examples of isosurface maps visualized by XCrySDen [66]. These data are output in a form of the Gaussian cube. So, many software, such as Molekel [65] and XCrySDen [66], can be used for the visualization. One can find the details of output files in the cube format in the Section 'Output files'.
 |